Auto-Analysis
Auto-Analysis allows a user to rapidly run go/no-go tests on one or more parts. The system is designed to allow for rapid setup and use.
As of this writing, Auto-Analysis applies to Peak and RTG images only.
The basic steps for Auto Analysis are as follows:
- Create and position Regions of Interest on a "golden" part or sample
- Set Edge detection and alignment so that the template regions may be adjusted on each part to sample (if alignment necessary)
- Set Cluster settings for each template region (for features other than % Delam)
- Set decision trees for each template region (if necessary)
- Run Auto-Analysis
Part 1: Setup
Setting up Regions of Interest
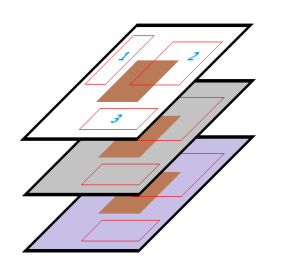
To being an Auto Analysis setup, the user must create Regions of Interest (ROIs) on one of the parts to be tested. If setting up Auto-Analysis on a Tray Scan, the ROIs must be set on an individual chip on a tray.
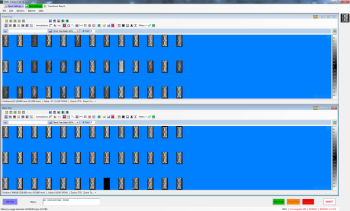
The set of ROIs generated is called a Template. When running Auto-Analysis, the same Template is used on each valid feature (e.g. each Data Gate result, SALI Gate result, etc.). On a Tray Scan, the templates will be repeated on each part.
Regions can be set up in two ways:
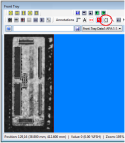
- Use the Area annotation to create regions, and then apply the regions to the Analysis Template
- Create the regions in the Auto-Analysis setup
 |
 |
Using Area Annotations and Applying Templates
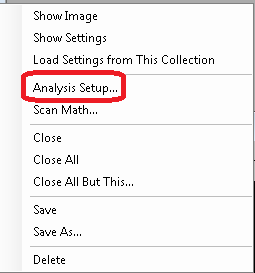
Using the Area annotation, the user creates one or more ROIs over the desired area of a single part. To establish the Template, right-click on any ROI to bring up the annotation menu. Select "Set as Analysis Template" to set the selected ROIs as the current template.
Templates are established per channel. Thus, if ROIs are established on one channel, they will not be copied to a different channel.
In order to create a Template on another channel, the user must either:
- create ROIs and call "Set as Analysis Template" again, or
- Copy the channel settings in the Analysis Setup dialog (see below).
Once a Template is established, an Auto Analysis setup can be configured. To open the Analysis Setup dialog, right click on the scan collection icon at the right of the ODIS screen, and select the "Analysis Setup" menu item.
Creating Regions in Auto Analysis Setup
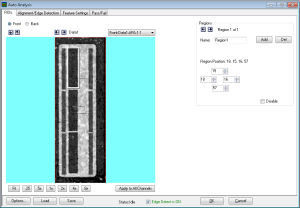
Alternatively, the user can create regions directly in the Auto Analysis setup dialog, without creating them in the Image form. To do this, simply press the "Add" button next to the region name on the "ROIs" tab. This will create a region based on the size specified in the Region Position inputs. Create multiple regions by pressing the "Add" button repeatedly.
To delete regions, press the "Del" button. This will delete the currently selected Region.
Template fine adjustment and Naming
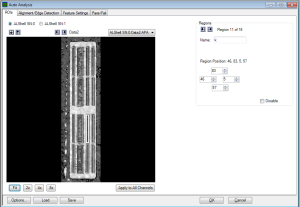

The Auto Analysis form is divided into tabs for different configuration setups. The first tab (ROIs) allows the user to give a custom name to each region, and also make fine adjustments to the initial region position. Each region is adjusted individually by clicking on the left-right arrows above the Name field. The currently selected region will be highlighted on the image.
Regions can also be adjusted by dragging and resizing them using the left mouse button. To change, move the mouse over the region to be moved and click on the highlighted "grab" points. The "grab" point with an "X" will move, and the remaining will resize.
The user can navigate through the images to find the best setup by using the channel up/down buttons (at left above the image), the Gate buttons (in the middle), and the image drop-down (at right).
The user can also zoom up to 8x the original size of the image using the sizing buttons below the image view, and can Pan around on the image by right-clicking until the "Hand" icon appears.
In multi-channel systems, the Template can be applied to all channels by pressing the "Apply to All Channels" button. This will override any manual template setups on other channels.
To disable a region temporarily, click on the "Disable" checkbox at the bottom left of the region selection.
Once the initial position of the templates has been adjusted, the user should click on the "Alignment/Edge Detection" page to configure edge setup.
If parts are identical on multiple channels, the best option for a user is to do a complete setup on one channel, then press the "Apply to all channels" button once the Edge Detect, Feature Settings, and Pass/Fail options are complete. This will duplicate the settings on all available channels.
IMPORTANT: If further adjustments should be made to the basic template, the user should disable Edge Detect using the checkbox at the bottom of the dialog (Marked "Edge Detect is ON"). This will prevent adjustments from being impacted by the Edge Detection code.
Edge Detection Setup
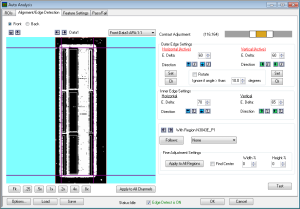
There are three levels of edge detection: Outer Edge settings (at the top), Inner Edge Settings (middle) and fine adjustment settings (at the bottom). Either one, both, or neither may be used for analysis.
If analyzing an entire image without regard to position, Edge Detection is unnecessary and may be turned off.
Using the Contrast Slider
The Contrast slider allows the user to adjust the image to improve edge and cluster detection. By using the slider bar, defects can be enhanced. This improves coarse and fine edge detection.
The Contrast Slider has two handles: Min and Max (the white boxes) both can be moved individually. Selecting the yellow region in between will move both at the same time.
 |
 |
If the live contrast adjustment is sluggish, uncheck the "Auto-Update" box just above the Edge Detection settings. To update the contrast and test Edge Detect, click on the "Refresh" button.
Contrast adjustment is used strictly for analysis edge detection, and will not alter the raw data in any way.
Outer/Inner Edge Detection
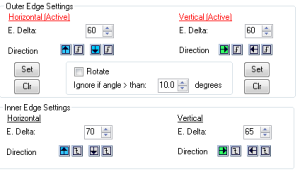
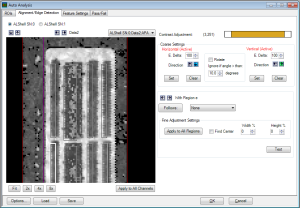
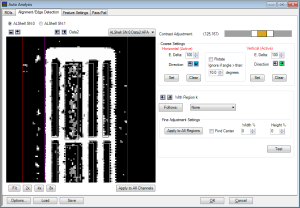
The Edge Detection Settings are used to find a major edge of the part in order to do gross adjustments of all template positions. The Direction and sensitivity of the edge can be set using the Delta and Direction buttons. The user can check how well the edge detection is working by paging through the images and observing the purple lines (representing the found horizontal and vertical edges). The Outer Edge looks for edges starting from the edge of the image data. The Inner edge detection will look for an additional edge starting at the location of the outer edge. If the Outer Edge is not found, the corresponding Inner Edge will not be detected.
The Edge Delta determines the difference in intensity required between two positions for the difference to count as an edge. Generally, the higher the difference, the greater the contrast should be. Any individual edge search can be deactivated by clicking on the arrows until the background color is gray. An active edge detect will show colors.
In this configuration, the Inner Down-searching Horizontal edge is deactivated, as are both the Inner and Outer Vertical right-searching edges. Further note: all Outer edges are looking for Rising Edges, and the Inner edges are looking for Falling Edges.
The polarity of the edge (e.g. whether or not to search for a Rising or Falling Edge) can be selected using the Polarity buttons next to the edge directions (they look like a cursive "f" symbol in Figure 10 above). To change the Polarity, click on the button.
When satisfied with the gross edge detection, pressing the "Set" button will cause the system to maintain a constant distance between the edge and the position of the templates. Again, paging through the images will show the user how well this is working. Pressing "Clear" will turn off this setting.
To see what the template positions would look like without edge detection, but without clearing the Edge detection settings, uncheck the "Edge Detect is ON" checkbox a the bottom of the dialog.
Fine Edge Detection
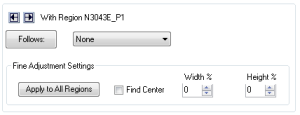
The Fine Adjustment settings are used to adjust each region individually, or in groups (if a Parent region is selected). If active, gross adjustments apply before Fine Adjustments.
The Fine Adjustment setting for one region can be applied to all regions using the "Apply to All Regions" button.
To activate, click on the "Find Center" checkbox. The sensitivity of the search region used to find each part can be adjusted by changing the H% and V% (horizontal and vertical %) on each region. The percentages represent the amount of extra search area around the region that will be tested, in terms of the size of the specified region.
Since the Fine Edge detection is set individually on each region, it may have an adverse affect on the overall position of the region.
To clear fine adjustments, turn off "Find Center" and press the "Apply to All Regions" button.
Parent/Child Regions
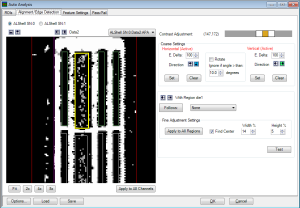
A region can be set to follow another region for Fine Edge Detection. If a region is a follower (e.g. Child), it will be shown in green. Regions that are followed (e.g. a Parent) will be shown in Yellow. Regions that are neither children nor parents are shown in white.
If the region is a Parent region, any children of the parent will be offset by the same amount.
Parent/Child applies only to Fine Edge Detection.
Clearing Edge Detection
To turn off Edge Detection entirely, *all* of the following must occur:
- Disable contrast adjustment
- Clear both Direction options in Outer Edge Settings.
- Turn off both inner and outer Edge Detection settings arrows.
- Turn off the "Find Center" option and apply it to all regions.
Feature Settings
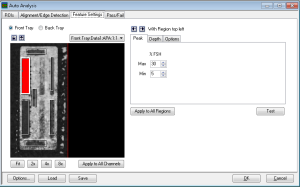
Cluster Analysis is used to find relevant data within an ROI, and also used in the Decision Tree results (See Decision Trees) Each region can have separate Cluster Analysis settings.
Cluster Analysis looks for pixels within a %FSH range, and marks the results. The user can make adjustments to each region individually. To apply the same settings to all regions, click on the "Apply to All Regions" button.
When satisfied with the way Cluster Analysis is working, move on to the "Pass/Fail" tab.
Decision Trees
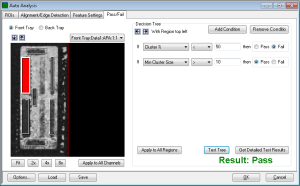
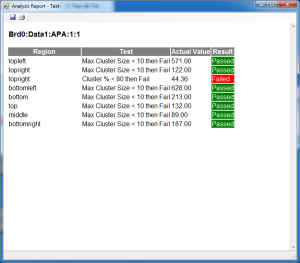
In order to test the results on a part, a Decision Tree must be made consisting of one or more tests. A decision tree is available for each region of Interest.
A Decision Tree entry consists of a Feature (e.g. Cluster %), a Comparator (greater than, less than, equal, etc.) a Comparison (entered by the user) and a Pass/Fail decision. A Region is considered to have failed if any of its tests fail. Conversely, if all tests pass the region is considered to have passed.
If all regions on a part have passed (and possibly all features on the part, see Auto Analysis Options), the part is considered to have passed inspection.
Running Auto-Analysis Without a Decision Tree
If the user does not establish a Decision Tree, by default the system will generate a list of clusters based on the parameters in Feature Settings. Any such region will be considered "passed" when determining whether or not a part has passed Analysis.
Testing the Analysis
The Analysis of a single part can be tested by pressing the "Test Tree" button on the Pass/Fail page. An immediate result will be displayed below the button, Green if passed, Red if failed. To get detailed results, press the "Get Detailed Test Results" button: this will display a report on the tests that were performed on the part.
Auto-Analysis Options
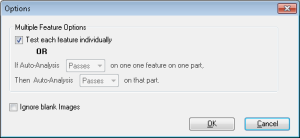
The user can determine how a part is tested when there are multiple features present (e.g, two Data Gates both collecting Peak information). To set, press the "Options" button at the bottom of the Analysis Setup Form. A dialog will appear, allowing the user to set the method desired.
Auto-Analyis is designed to test a single feature at a time. Because a user may generate many features on a part, whether the part "passes" or "fails" depends on how the Auto-Analysis deals with the features from a part as a whole. Changing the Analysis Options has the following effect:
- If the setting is "Test each Feature Individually", then each feature will have a green border or a red border, depending on whether or not the individual feature passed or failed.
- If a part is set to Fail if any of the features Fail, paging through the features of a part where one feature failed will not affect whether the part is considered to "fail" (e.g., it will keep the red border. A part will only have a green border if all features pass the analysis.
- If a part is set to Pass if any of the features Pass, paging through the features of a part where one feature passsed will not affect whether the part is considered to "pass" (e.g., it will keep the green border. A part will only have a red border if all features fail the analysis.
If "Ignore Blank Images" is checked, then Auto-Analysis will skip any image that contains no data. No results will be generated and the feature will not have a border.
Applying, Loading, and Saving Analysis Settings
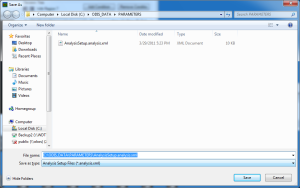
When the user presses the "Apply" button on the Analysis window, the current Analysis settings are saved in memory, and will be used on all Auto-Analyses until another setup is loaded. Pressing "OK" will save the current analysis settings in memory and close the dialog. If the user hits "Cancel", Changes to Auto Analysis settings since the last "Apply" are discarded.
Analysis settings can be loaded or saved from disk at any time using the "Load" and "Save" buttons at the bottom of the screen. Files are saved in a XML file with the extension "analysis.xml". When an Analysis file is loaded, it overrides any other Analysis setup in memory.
To clear the current Analysis settings, press the "Clear" button at the bottom of the Analysis window. After a warning, this will remove all Analysis setup and revert to defaults.
Analysis Status
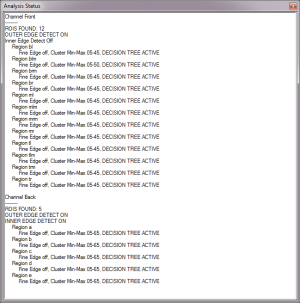
A summary of the current Analysis Setup can be displayed by pressing the Status button on the Analysis Setup window. This will show which channels have a Template, whether Edge Detect is on, Cluster Setups, and which regions have Decision Trees.
Part 2: Using Auto-Analysis
Running Analysis

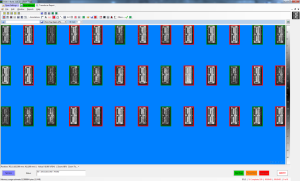
Once Analysis is established, the user can run a full Auto-Analysis on a part or tray of parts by pressing the green Check box button in the Analysis tools. Analysis will immediately start upon pressing the button.
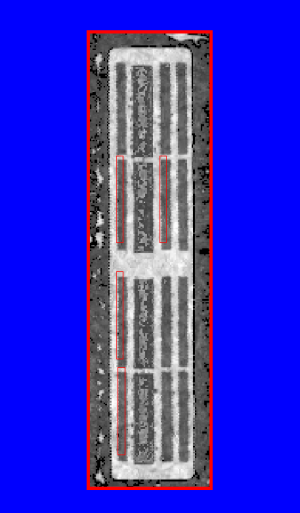
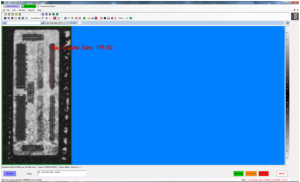
When Analysis is complete, the part or parts will be highlighted with a red border (if the test failed) or a green border (if it passed).
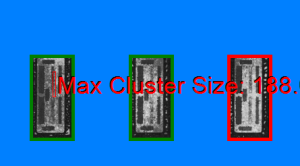
By moving the mouse over the part, the results of the test or tests on a region will be displayed automatically. This is true when viewing an individual part or a tray of parts. If a region failed analysis, it will be highlighted in Red.
If no Decision Tree was present on a region, only the Cluster results will be displayed. The region is considered to be "Passed" by default (although a part may still fail Analysis due to results from other regions).
All region results can be displayed by turning on the "Show All Auto-Analysis Regions" option.
 |
 |
 |
The location of the region on the part will reflect any adjustments made in the Edge Detection. Using this, an operator can confirm that the regions were properly aligned during the test.
Analysis results are saved with the image data, and will be recalled the next time the image is loaded. It is therefore possible to see the analysis results on a system that does not have the Analysis setup defined.
Post-Analysis Adjustments
 |
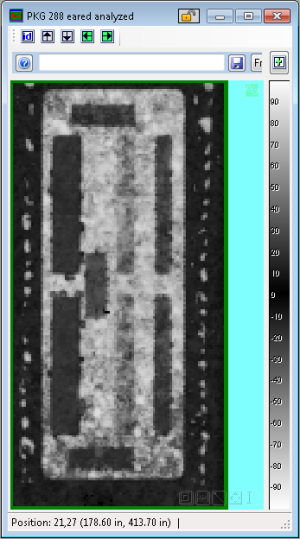 |
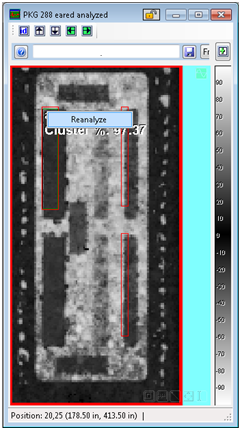
If analysis fails on a particular part and it appears to be a problem of offsets, it is possible to reanalyze the part. Simply right-click on one of the bad regions and select "Reanalyze" from the resulting drop-down menu. Now, when you left-click on the image, the position of the regions will be set to the new point at which you clicked.
After the region is repositioned, the part is automatically reanalyzed. If it succeeds, a green border will appear around the part. To save the reanalyzed data, simply resave the image.
The corner used to position the regions depends on the orientation of the image. By default, the regions are referenced to the top left. See the "Default Orientation" option in Configuration for details.
Reanalysis can be disabled by checking the "Disable Renalysis" option.
Analysis Reports
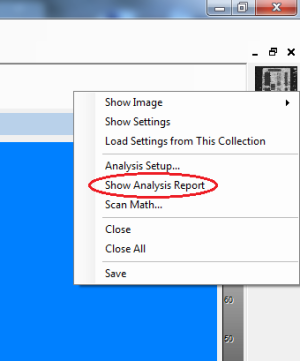
To display and save the full Report, the user should right-click on the image icon for the scan collection. From the resulting menu, select the "Show Analysis Report" item. This will display a report that shows the results for all parts and features.
The Analysis report uses the "AnalysisReport.xslt" and "AnalysisReport.css" files in your ODIS_DATA/REPORTS directory to generate the report. These reports can be changed as desired.
The report can be printed or saved to disk as an HTML document.
Using Auto-Analysis in Production Mode
In Production Mode, if operating on a scanning system, a button for Analysis must be added to the ODIS_Production.xml file. This button will automatically load and run an Auto-Analysis setup that has the same name as the last parameter file that was run. If the analysis file does not exist, an error message will appear.
   <Button name="Analysis" id="99999">
     <Action type="Analysis"></Action>
   </Button>
To load an Analysis setup manually or to use Analysis on a Production system in Offline-Analysis mode, add the prompt attribute to the Analysis: this will let the user select the Analysis file to be run. After loading the analysis setup, it will be run automatically.
   <Button name="Analysis" id="99999">
     <Action type="Analysis" prompt="true"></Action>
   </Button>
The Analysis report and results behave the same as in ODIS Advanced or Basic Mode.